
Financial Highlights
Historical Trend of Major Financial Indexes (Consolidated Basis)
| Consolidated Business Index | March 2018 |
March 2019 |
March 2020 |
March 2021 |
March 2022 |
|---|---|---|---|---|---|
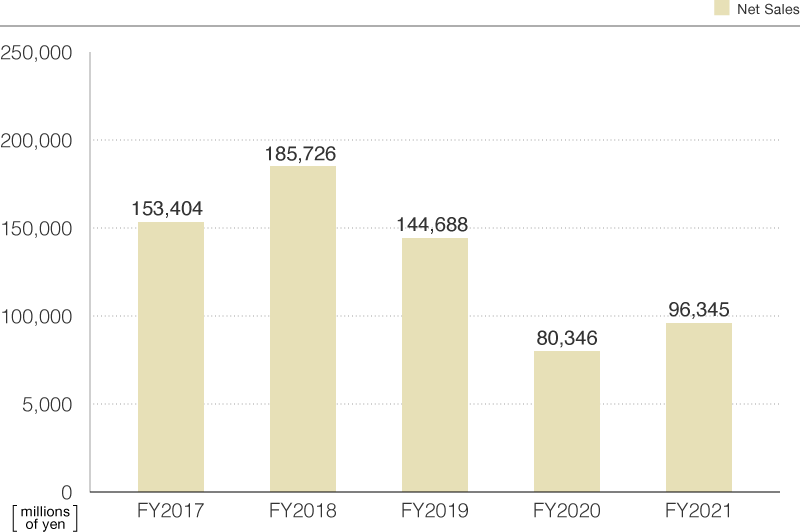
| Net Sales | 153,404 | 185,726 | 144,688 | 80,346 | 96,345 |
| Gross Profit | 25,151 | 26,590 | 25,840 | 12,518 | 15,327 |
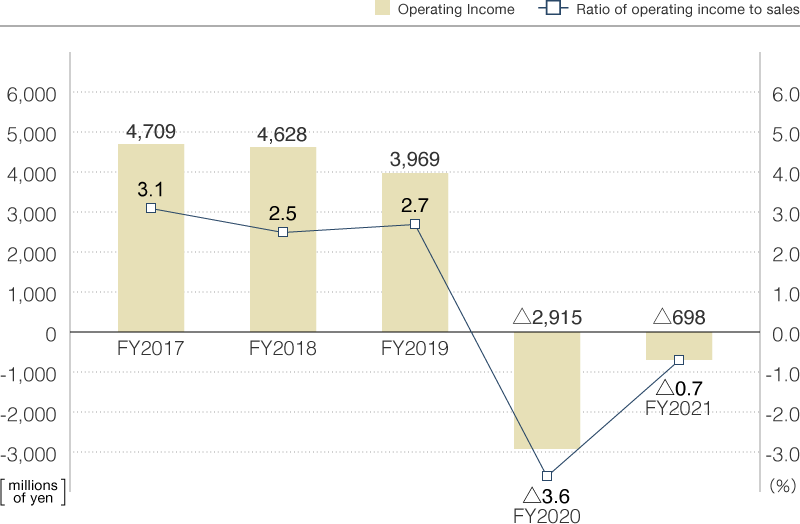
| Operating Income | 4,709 | 4,628 | 3,969 | △2,915 | △698 |
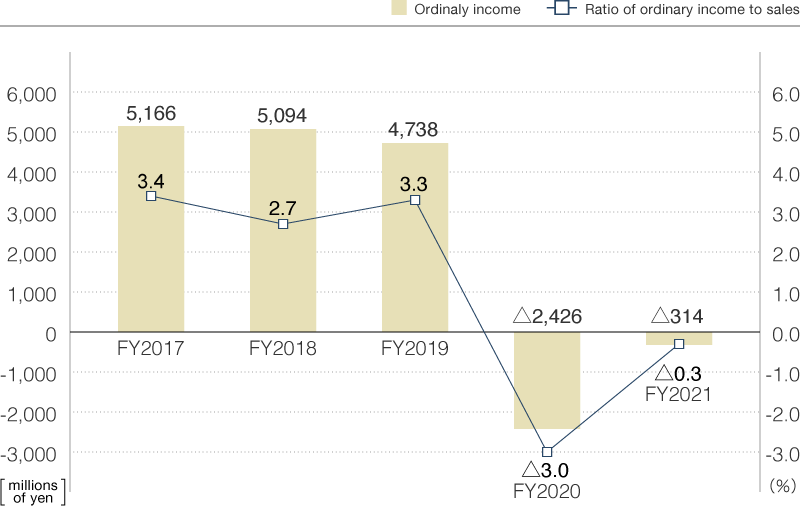
| Ordinary Income | 5,166 | 5,094 | 4,738 | △2,426 | △314 |
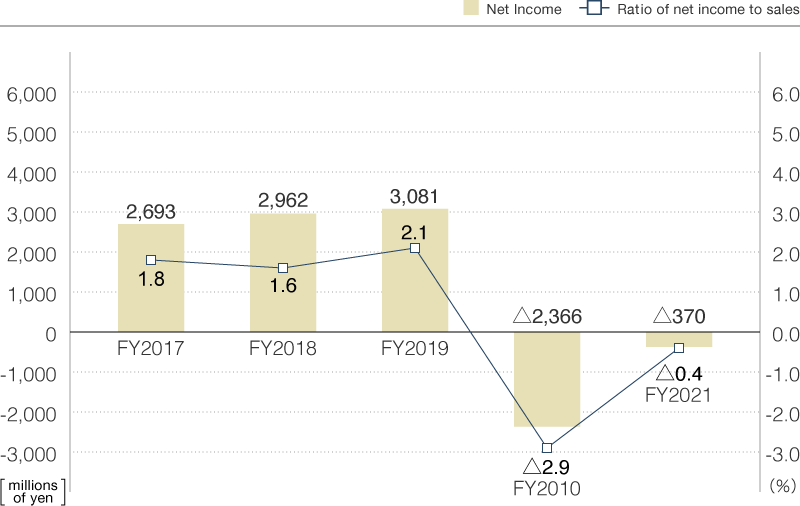
| Net Income | 2,693 | 2,962 | 3,081 | △2,366 | △370 |
| Total Assets | 49,013 | 56,887 | 60,844 | 52,276 | 52,295 |
| Net Assets | 23,634 | 26,051 | 28,046 | 24,685 | 24,306 |
| Interest-bearing Debt | 5,629 | 11,750 | 14,329 | 13,904 | 13,838 |
| Ordinary Income to Total Assets Ratio(ROA) | 11.1% | 9.6% | 8.0% | △4.3% | △0.6% |
| Return on Equity(ROE) | 12.8% | 12.9% | 12.2% | △9.5% | △1.6% |
Net Sales
*The business segment divided into 4types from June18,2008
Operating Income
Ordinary Income
Net Income